How to automate a Search Console data report on Notion with n8n

How to automate a Search Console data report on Notion with n8n
My n8n workflow for monthly GSC reports on Notion.
 Ian Sorin
November 16, 2025
5 min read
Ian Sorin
November 16, 2025
5 min read
I have some clients who ask for monthly monitoring just to see where things stand, without needing very advanced data analysis: we keep it basic.
Because that’s the limit of automation. It’s great for doing generic and repetitive tasks, but it’s almost impossible to get a professional and actionable output from it.
For this client’s needs, we’re not doing that; a basic report is enough. So I might as well save time on this instead of fighting with the Google Search Console interface.
This workflow model (which I’ve duplicated for several clients) saves me a good 4 hours per month.
Here’s a breakdown of how it works and a few tips I picked up along the way.
What Does This Thing Actually Do?
My workflow does the following, every single month:
- Fetches performance data for the entire previous month.
- Fetches performance data for the same month of the previous year for a true year-over-year comparison.
- Calculates the overall evolution: Total clicks, difference, and percentage change.
- Identifies the big movers: It finds the top 10 pages and top 10 queries that have gained the most clicks.
- Flags the losers: It also finds the top 10 pages and queries that have lost the most clicks.
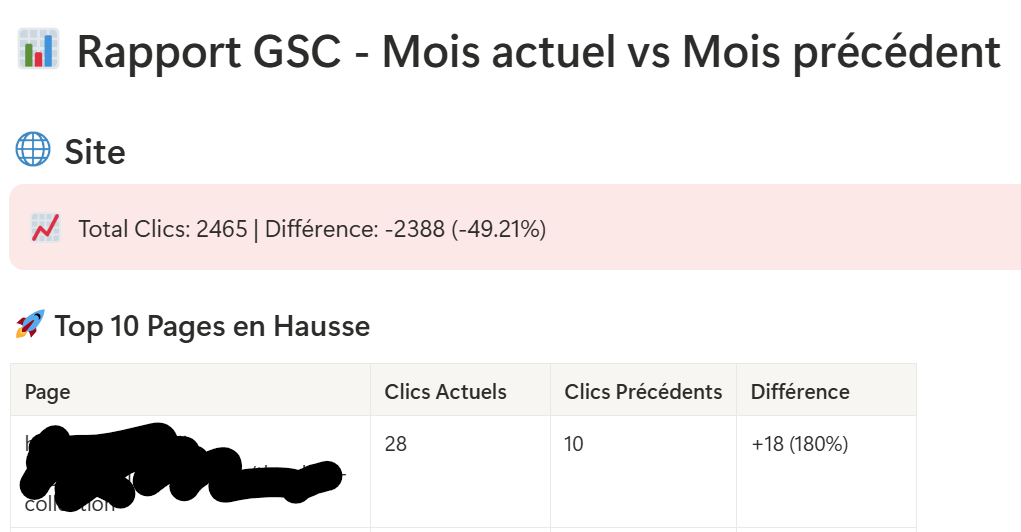
- Builds a clean report in Notion: It takes all this data and formats it into a structured, easy-to-read page with headings, tables, and color-coded callouts.
For the client i’m showing it does this for 2 subdomains (US and UK in my case) in one go.
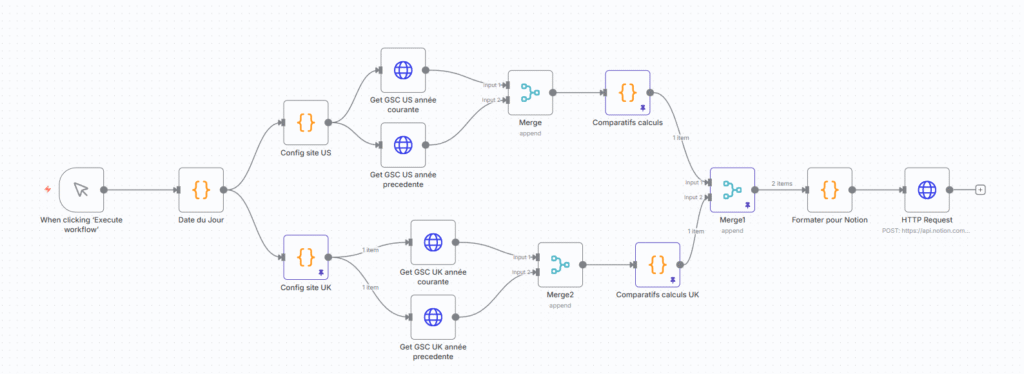
How It Works: The Core Components
Here are the key steps in the workflow:
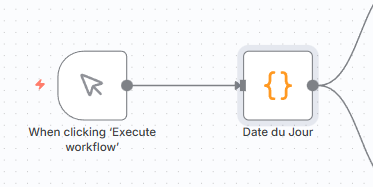
1. The Time Machine: Dynamic Date Calculation 📅
The first thing the workflow does is figure out the date ranges. I’m not manually inputting “October 1st to October 31st.” A simple Code node in n8n uses JavaScript to automatically calculate:
- The start and end date of the previous month.
- The start and end date of the same month, last year.
This single step makes the entire automation evergreen. You set it up once, and it runs forever without you ever having to touch a date field again.
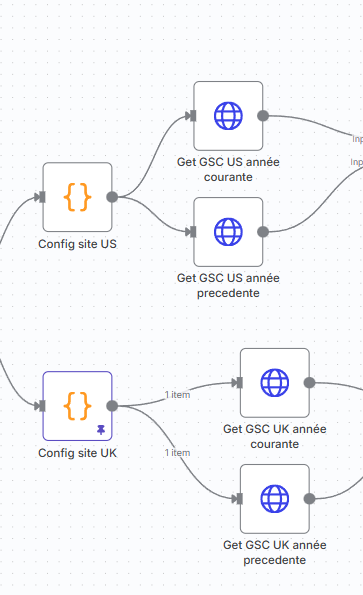
2. Talking to Google: The API Call 🗣️
This is where we actually get the data. Since there’s no native GSC node in n8n, we use the good old HTTP Request node.
To build the year-over-year comparison, the workflow makes two separate API calls for each subdomain:
- Call 1: Fetches data for the entire previous month.
- Call 2: Fetches data for the same month of the previous year.
Both of these are POST requests to the GSC API’s searchAnalytics/query endpoint. This requires a one-time setup in Google Cloud Console to get your OAuth2 credentials, which sounds intimidating but is a quick job. In the body of each request, we tell Google exactly what we want by specifying the startDate and endDate for each period, along with the dimensions (in my case, page and query) to define the granularity of the data.
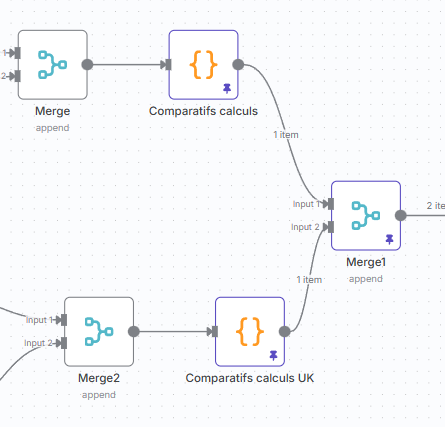
3. The Brains of the Operation: Crunching the Numbers 🧠
Raw data is useless. The real value comes from the next Code node, which I call “Comparatifs calculs” (Calculation Comparisons in french). This block of JavaScript is the heart of the automation.
It takes the data for the current and previous periods and:
- Sums up total clicks for each period to get the main KPI.
- Calculates the difference and percentage change.
- Groups all the data by page and by query.
- Compares the performance of each individual page/query against the previous period.
- Sorts them to find the top 10 winners and losers.
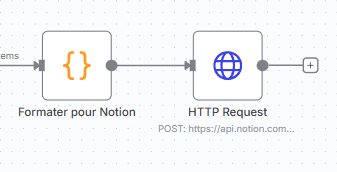
4. The Grand Finale: Building the Notion Report 📝
The final step is turning those insights into something a human can actually read. Another Code node formats everything into Notion’s specific JSON block structure. This includes:
- Headings for each section (US site, UK site, Top Pages, etc.).
- Color-coded callouts for the main metrics (green_background for growth, red_background for a drop). It gives you the main takeaway in less than a second.
- Tables with headers for the top 10 lists.
Finally, another HTTP Request node sends this neatly packaged JSON to the Notion API, which instantly creates the new page in my reporting database. (Note: This requires a one-time setup in Notion’s integration settings to authorize the API to create pages in that specific database).
A Few Tips I’ll Give Away for Free
- Parameterize Everything. Notice how my workflow has separate “Config” nodes for the US and UK sites? This is key. By defining the siteUrl and siteName at the beginning, you can easily add more sites just by copying that block. Don’t hardcode URLs into your API calls.
- The Presentation Layer is Non-Negotiable. Don’t just dump JSON into a Slack message. The reason this workflow is so powerful is that it ends with a clean, readable report. Stakeholders don’t care about your API calls; they care about clear insights. The Notion formatting step is what makes the data useful to others.
- Get Familiar with the API Docs. My request uses page and query dimensions, but you can also group by country, device, and more. Spend 10 minutes with the official Google Search Console API documentation. Understanding the available parameters is how you’ll customize this to pull the exact data you need.

Ian Sorin is an SEO consultant at Empirik, a digital marketing agency based in Lyon, France. He’s increasingly automating time-consuming daily tasks but he’s careful never to fall into the “100% automated” trap where human judgment disappears entirely. Because the point of automation isn’t to remove humans from the equation; it’s to remove the busywork so humans can focus on strategy and insights. Passionate about understanding how search engines truly work, he builds tools to automate analysis, runs experiments on his own projects, and constantly digs into the numbers to uncover new growth opportunities.