Free SEO Looker Studio Dashboard and a Tutorial to use it

Free SEO Looker Studio Dashboard and a Tutorial to use it
A plug-and-play dashboard to analyze your performance.
 Ian Sorin
October 23, 2025
5 min read
Ian Sorin
October 23, 2025
5 min read
I needed some hands-on practice with Looker Studio.
So today, I’m sharing a free SEO dashboard you can use to analyze your performance and pull out some interesting insights for your strategy.
But still, I think it’s worth checking out.
I’m actually pretty happy with how it turned out for a dashboard built from scratch.
In this article, I’ll walk you through the dashboard, show you how to make the most of it, and share a few key insights you can extract from it.
So, this Looker Studio dashboard is made up of five pages, with a sidebar menu on the left that lets you navigate between them, basically five different dashboards in one.
“Stats Générales” – Overall Performances of your Website
The home page, which is the first thing you’ll see, isn’t necessarily the most exciting part. It’s a pretty standard overview page that displays your overall performance once you’ve connected your Google Analytics 4 account.

You’ll be able to see your views coming from Google (marked with the G logo), your traffic from Bing (Windows logo), and even the views you’ve gotten from ChatGPT.
There’s also a comparison line showing how those numbers stack up against the previous year.
“Perfs Pages SEO” – Pages’s SEO Performance (Query Counting)
The second page gives you insights on something I find super interesting : what I call query counting.

Basically, for each URL, the table calculates how many keywords that page ranks for.
Why do I like this metric so much? Because it gives you a much clearer view of how your page performs without being skewed by seasonality, SERP features like adds, or those random snippets Google loves to add. It strips away all that noise.
It also helps you understand how your page is evolving inside Google’s ecosystem.
👉 Is Google testing your URL on new keywords?
👉 Has it tested your page on certain queries but decided it wasn’t the best match?
If that’s the case, you’ve got two options:
- Strengthen that specific page for the given keyword, or
- Create a new, dedicated page that’s more relevant to that query.
Overall, the best insight from this query counting table is that it helps you grasp how Google perceives the quality of your page.
The higher the perceived quality, the more queries your page will tend to rank on.
So, if the number of queries for a given page increases, it either means:
- Google sees your page as higher quality, or
- Google is simply testing your new page across multiple queries.
On the flip side, if that number drops, it’s often a sign that Google has either:
- Tested your page on some keywords and decided to drop it, or
- Started perceiving the page as less relevant overall.
I ran into a few limitations with Looker Studio, so if you want to see one of the more interesting insights (like which queries your page used to rank for but doesn’t anymore) you’ll need to switch over to Google Sheets.
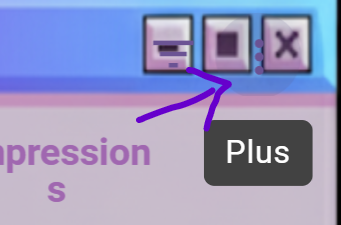
It’s a bit of a hidden trick:
Hover over the top bar of your table, click the three little dots, then hit “Export data.”
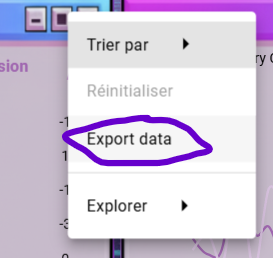
⚠️ Before doing that, make sure you’ve filtered your table to a single URL otherwise, your export will be a mess.
Once you’re in Google Sheets and you’ve got your table, sort your data by the biggest drop in clicks compared to the previous period.
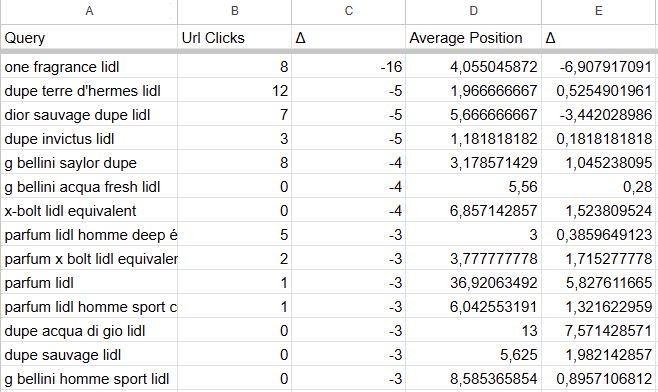
From there, for each URL that’s lost a significant number of clicks, look at the change in average position:
- If you’ve lost clicks but your average position stayed the same, it probably means that people just searched for that topic less, or that the SERP got more crowded.
- But if you’ve lost a lot of clicks and your average position dropped sharply, then Google has likely un-ranked your page for that keyword, and it’s time to act on it.
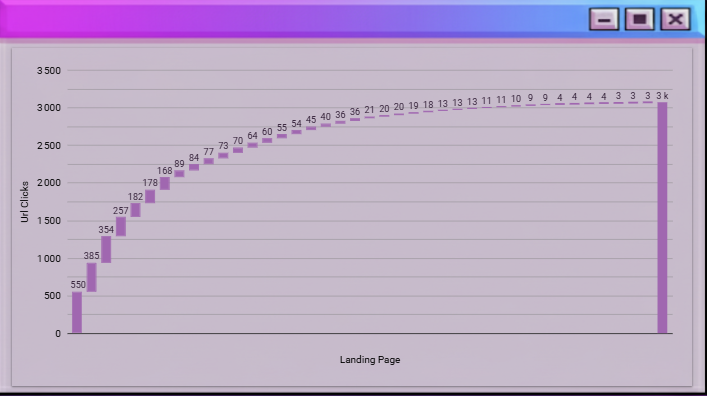
“Dangers SEO” – How many pages carry your organic traffic
The third page, called “SEO Danger” in French, shows you the proportion of pages driving your traffic compared to your site’s total.
This table helps you see how many pages your site actually relies on to generate SEO traffic.
If only a handful of pages are bringing in most of your visits, that’s a potential risk for your organic acquisition.
Here’s a concrete example:
This site relies on too few pages to drive its SEO traffic : that’s a red flag.
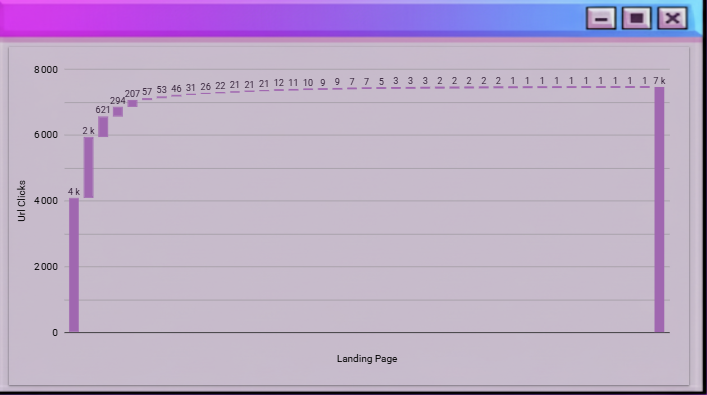
If one or two of those pages drop in rankings, the site’s overall traffic could tank.
On the other hand, this second site has a much wider spread of traffic-generating pages, making its SEO profile more stable and resilient.
“Maillage Interne” – Find the strategics anchors for your Internal Linking
The fourth page is pretty straightforward : it helps you find the anchor texts to use for a given page in your internal linking strategy.

Here’s the idea: if a page is already ranking, say, in the top 10 or top 15 for a specific keyword, then using that keyword as an anchor text when linking to the page can theoretically help it climb even higher.
That way, you’re reinforcing the semantic relevance of your target page through smart internal linking.
“Stats GA4 Pages” – Overall user data and behaviour on your pages
The last page of the dashboard pulls general stats from Google Analytics 4 to help you analyze your pages’s performance, especially user behavior.

You’ll be able to see things like how long visitors stay on a page, your bounce rate, and how many pages they view per session or per user.
In short, it’s the page that helps you understand what people actually do once they land on your site.
That’s what my very first Looker Studio dashboard, built entirely from scratch, can do and the kind of insights it can provide.
Feel free to use it, I really hope it helps you out!
And if you have any questions, especially about translations (since some of the text on the dashboard is still in French), don’t hesitate to reach me out.
See ya! 👋

Ian Sorin is an SEO consultant at Empirik agency in Lyon, France. He doesn’t like basing SEO decisions on gut feeling, he prefers relying on data to guide every move. Passionate about understanding how search engines truly work, he builds tools to automate analysis, runs experiments on his own projects, and constantly digs into the numbers to uncover new growth opportunities.